This guide demonstrates how to configure comprehensive monitoring for Milvus clusters in KubeBlocks using:
Before proceeding, ensure the following:
kubectl create ns demo
namespace/demo created
Deploy the kube-prometheus-stack using Helm:
helm repo add prometheus-community https://prometheus-community.github.io/helm-charts
helm install prometheus prometheus-community/kube-prometheus-stack \
  -n monitoring \
  --create-namespace
Check all components are running:
kubectl get pods -n monitoring
Expected Output:
NAME                                                     READY   STATUS    RESTARTS   AGE
alertmanager-prometheus-kube-prometheus-alertmanager-0   2/2     Running   0          114s
prometheus-grafana-75bb7d6986-9zfkx                      3/3     Running   0          2m
prometheus-kube-prometheus-operator-7986c9475-wkvlk      1/1     Running   0          2m
prometheus-kube-state-metrics-645c667b6-2s4qx            1/1     Running   0          2m
prometheus-prometheus-kube-prometheus-prometheus-0       2/2     Running   0          114s
prometheus-prometheus-node-exporter-47kf6                1/1     Running   0          2m1s
prometheus-prometheus-node-exporter-6ntsl                1/1     Running   0          2m1s
prometheus-prometheus-node-exporter-gvtxs                1/1     Running   0          2m1s
prometheus-prometheus-node-exporter-jmxg8                1/1     Running   0          2m1s
Please refer to Deploying a Milvus Cluster with KubeBlocks to deploy a milvus cluster.
kubectl -n demo exec -it pods/milvus-cluster-proxy-0 -- \
  curl -s http://127.0.0.1:9091/metrics | head -n 50
Perform the verification against all Milvus replicas, including:
apiVersion: monitoring.coreos.com/v1
kind: PodMonitor
metadata:
  name: milvus-cluster-pod-monitor
  namespace: demo
  labels:               # Must match the setting in 'prometheus.spec.podMonitorSelector'
    release: prometheus
spec:
  podMetricsEndpoints:
    - path: /metrics
      port: metrics
      scheme: http
      relabelings:
        - targetLabel: app_kubernetes_io_name
          replacement: milvus
  namespaceSelector:
    matchNames:
      - demo               # Target namespace
  selector:
    matchLabels:
      app.kubernetes.io/instance: milvus-cluster
PodMonitor Configuration Guide
| Parameter | Required | Description |
|---|---|---|
port | Yes | Must match exporter port name ('http-metrics') |
namespaceSelector | Yes | Targets namespace where Milvus runs |
labels | Yes | Must match Prometheus's podMonitorSelector |
path | No | Metrics endpoint path (default: /metrics) |
interval | No | Scraping interval (default: 30s) |
It sets up a PodMonitor to monitor the Milvus cluster and scrapes the metrics from the Milvus components.
  podMetricsEndpoints:
    - path: /metrics
      port: metrics
      scheme: http
      relabelings:
        - targetLabel: app_kubernetes_io_name
          replacement: milvus # add a label to the target: app_kubernetes_io_name=milvus
Forward and access Prometheus UI:
kubectl port-forward svc/prometheus-kube-prometheus-prometheus -n monitoring 9090:9090
Open your browser and navigate to: http://localhost:9090/targets
Check if there is a scrape job corresponding to the PodMonitor (the job name is 'demo/milvus-cluster-pod-monitor').
Expected State:
podTargetLabels (e.g., 'app_kubernetes_io_instance').Verify metrics are being scraped:
curl -sG "http://localhost:9090/api/v1/query" --data-urlencode 'query=milvus_num_node{app_kubernetes_io_name="milvus"}' | jq
Example Output:
{
  "status": "success",
  "data": {
    "resultType": "vector",
    "result": [
      {
        "metric": {
          "__name__": "milvus_num_node",
          "app_kubernetes_io_name": "milvus",
          "container": "indexnode",
          "endpoint": "metrics",
          "instance": "10.244.0.149:9091",
          "job": "demo/milvus-cluster-pod-monitor",
          "namespace": "demo",
          "node_id": "23",
          "pod": "milvus-cluster-indexnode-0",
          "role_name": "indexnode"
        },
        "value": [
          1747637044.313,
          "1"
        ]
      },
      {
        "metric": {
          "__name__": "milvus_num_node",
          "app_kubernetes_io_name": "milvus",
          "container": "querynode",
          "endpoint": "metrics",
          "instance": "10.244.0.153:9091",
          "job": "demo/milvus-cluster-pod-monitor",
          "namespace": "demo",
          "node_id": "27",
          "pod": "milvus-cluster-querynode-1",
          "role_name": "querynode"
        },
        "value": [
          1747637044.313,
          "1"
        ]
      },
      ... // more output ommitted.
Port-forward and login:
kubectl port-forward svc/prometheus-grafana -n monitoring 3000:80
Open your browser and navigate to http://localhost:3000. Use the default credentials to log in:
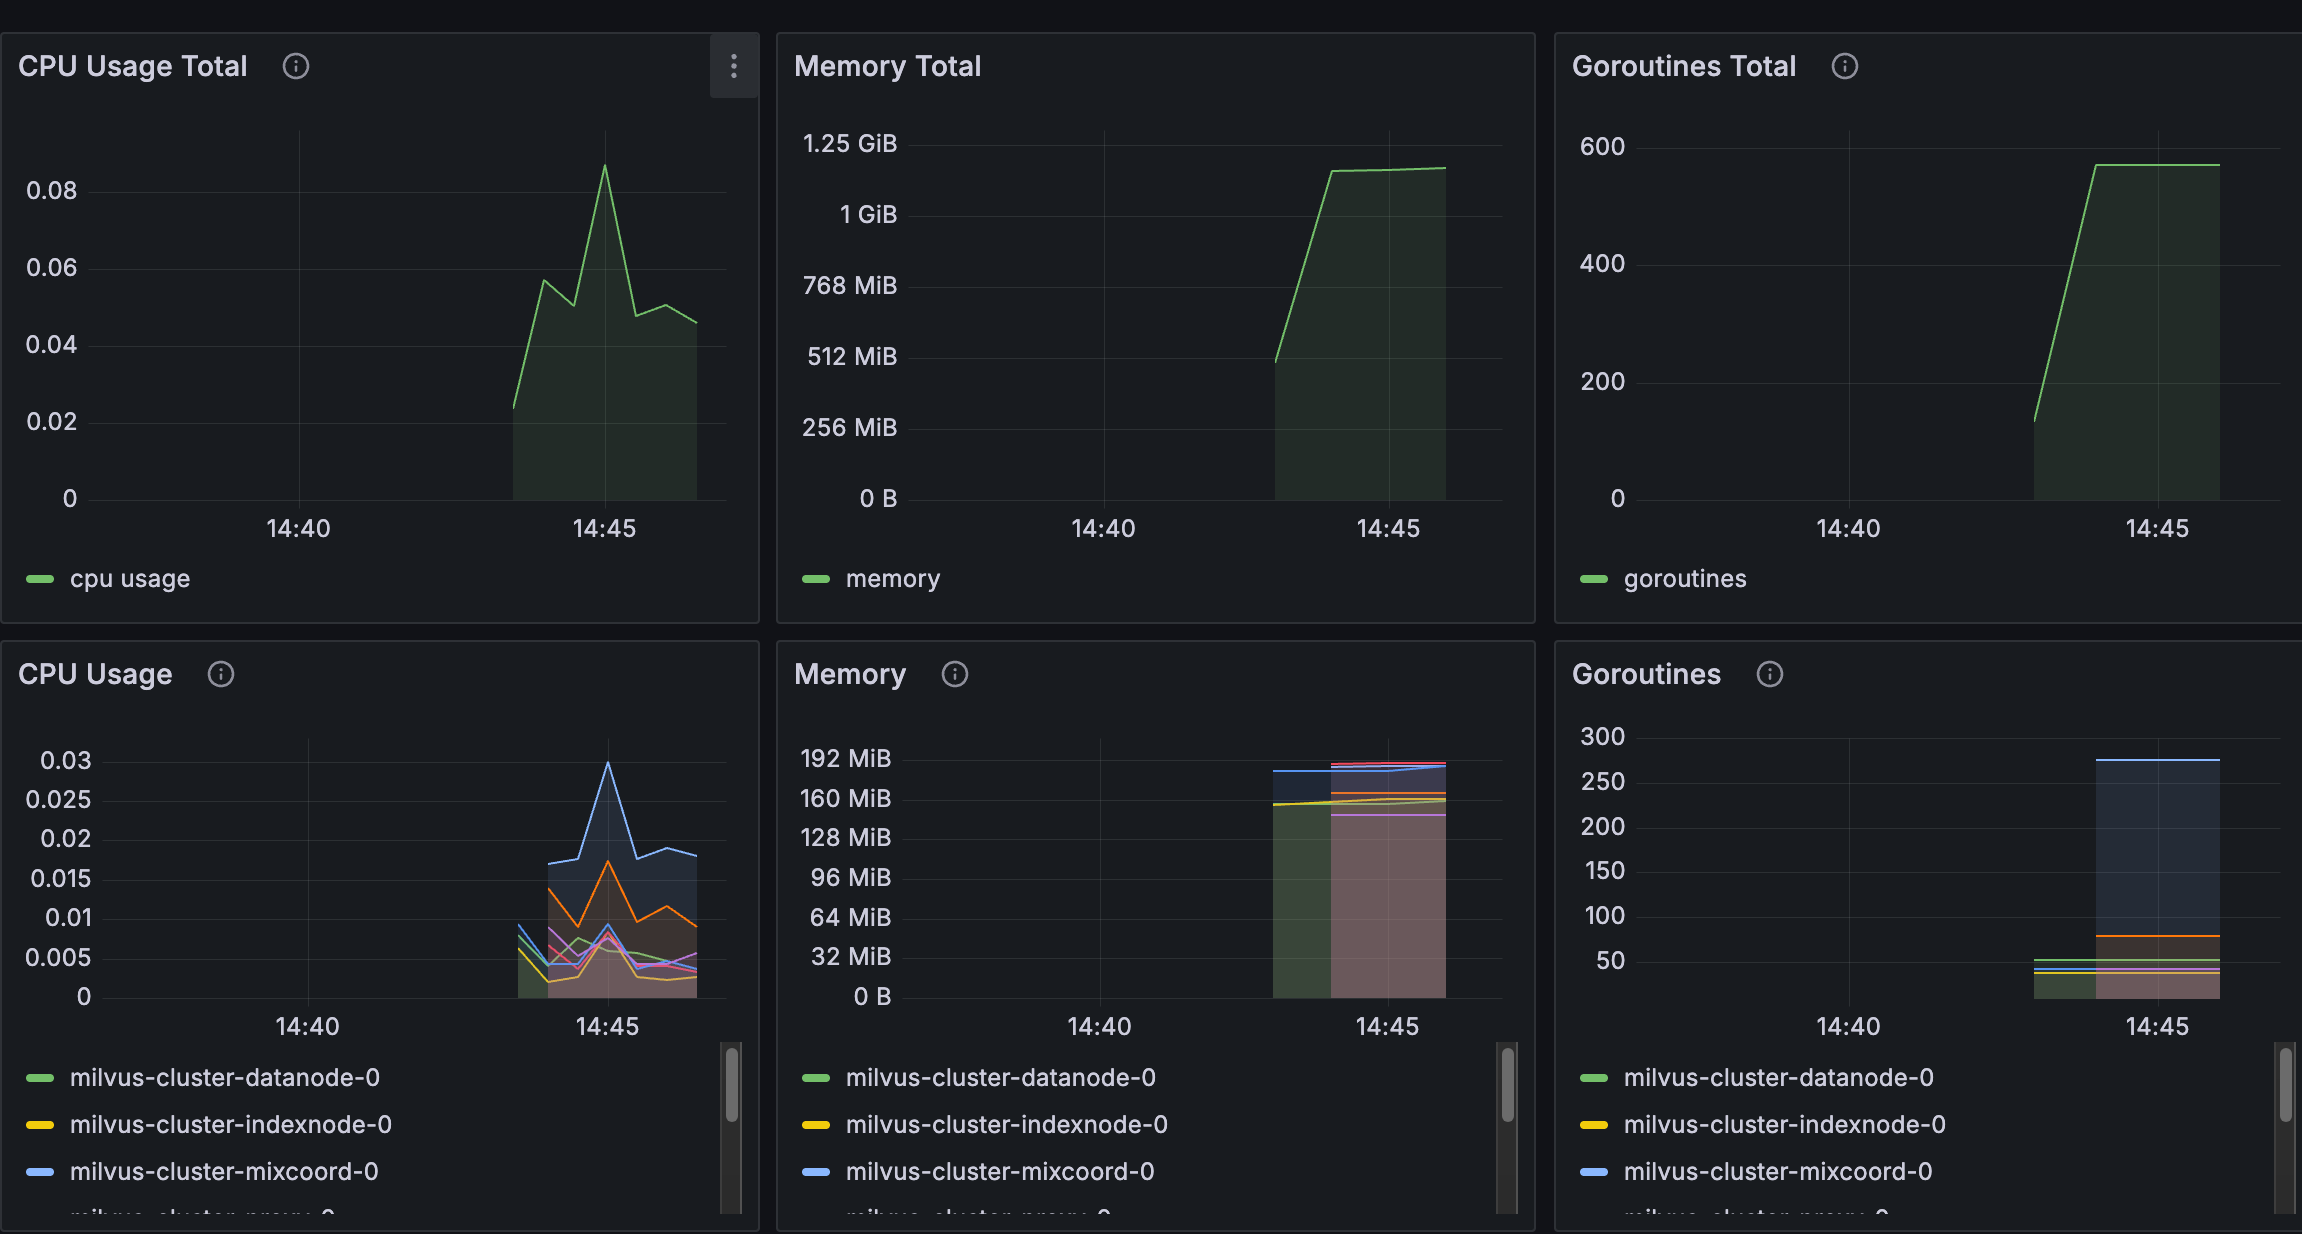
Import the KubeBlocks Milvus dashboard:
To delete all the created resources, run the following commands:
kubectl delete cluster milvus-cluster -n demo
kubectl delete ns demo
kubectl delete podmonitor milvus-cluster-pod-monitor -n demo
In this tutorial, we set up observability for a Milvus cluster in KubeBlocks using the Prometheus Operator.
By configuring a PodMonitor, we enabled Prometheus to scrape metrics from the Milvus exporter.
Finally, we visualized these metrics in Grafana. This setup provides valuable insights for monitoring the health and performance of your Milvus databases.