Topologies
Operations
Backup And Restores
Custom Secret
Monitoring
Before proceeding, ensure the following:
kubectl create ns demo
namespace/demo created
If the Prometheus Operator is not already installed, you can install it using Helm:
kubectl create namespace monitoring
helm repo add prometheus-community https://prometheus-community.github.io/helm-charts
helm install prometheus prometheus-community/kube-prometheus-stack -n monitoring --create-namespace
Or you can follow the steps in How to install the Prometheus Operator to install the Prometheus Operator.
Check the status of deployed pods:
kubectl get pods -n monitoring
Example Output:
NAME                                                     READY   STATUS    RESTARTS   AGE
alertmanager-prometheus-kube-prometheus-alertmanager-0   2/2     Running   0          114s
prometheus-grafana-75bb7d6986-9zfkx                      3/3     Running   0          2m
prometheus-kube-prometheus-operator-7986c9475-wkvlk      1/1     Running   0          2m
prometheus-kube-state-metrics-645c667b6-2s4qx            1/1     Running   0          2m
prometheus-prometheus-kube-prometheus-prometheus-0       2/2     Running   0          114s
prometheus-prometheus-node-exporter-47kf6                1/1     Running   0          2m1s
prometheus-prometheus-node-exporter-6ntsl                1/1     Running   0          2m1s
prometheus-prometheus-node-exporter-gvtxs                1/1     Running   0          2m1s
prometheus-prometheus-node-exporter-jmxg8                1/1     Running   0          2m1s
KubeBlocks uses a declarative approach for managing MySQL clusters. Below is an example configuration for deploying a MySQL cluster with 2 nodes (1 primary, 1 replicas) in semi-synchronous mode.
Apply the following YAML configuration to deploy the cluster:
kubectl apply -f - <<EOF
apiVersion: apps.kubeblocks.io/v1
kind: Cluster
metadata:
  name: example-mysql-cluster
  namespace: demo
spec:
  clusterDef: mysql
  topology: semisync
  terminationPolicy: Delete
  componentSpecs:
    - name: mysql
      serviceVersion: 8.0.35
      replicas: 2
      resources:
        limits:
          cpu: '0.5'
          memory: 0.5Gi
        requests:
          cpu: '0.5'
          memory: 0.5Gi
      volumeClaimTemplates:
        - name: data
          spec:
            storageClassName: ""
            accessModes:
              - ReadWriteOnce
            resources:
              requests:
                storage: 20Gi
EOF
Monitor the cluster status until it transitions to Running:
kubectl get cluster example-mysql-cluster -n demo -w
Example Output:
NAME                     CLUSTER-DEFINITION   TERMINATION-POLICY   STATUS    AGE
example-mysql-cluster   mysql                Delete               Creating   34s
example-mysql-cluster   mysql                Delete               Running   36m
Prometheus scrapes metrics from Pods using PodMonitor resources. Follow these steps to configure metrics collection:
To find the metrics endpoint of the MySQL exporter, run the following command:
kubectl get po example-mysql-cluster-mysql-0 -n demo -oyaml | yq '.spec.containers[] | select(.name=="mysql-exporter") | .ports '
Example Output:
- containerPort: 9104
  name: http-metrics  # <-- Port name for PodMonitor
  protocol: TCP
Define a PodMonitor to configure Prometheus to scrape metrics from the MySQL exporter. Update the namespaceSelector and port values as needed:
namespaceSelector must match your MySQL cluster's namespace ('demo')port name must match exporter's port name ('http-metrics')kubectl apply -f - <<EOF
apiVersion: monitoring.coreos.com/v1
kind: PodMonitor
metadata:
name: example-mysql-cluster-pod-monitor
namespace: monitoring # Note: this is namespace for prometheus operator
labels: # this is labels set in 'prometheus.spec.podMonitorSelector'
release: prometheus
spec:
jobLabel: app.kubernetes.io/managed-by
# defines the labels which are transferred from the
# associated Kubernetes 'Pod' object onto the ingested metrics
# set the lables w.r.t you own needs
podTargetLabels:
- app.kubernetes.io/instance
- app.kubernetes.io/managed-by
- apps.kubeblocks.io/component-name
- apps.kubeblocks.io/pod-name
podMetricsEndpoints:
- path: /metrics
port: http-metrics
scheme: http
namespaceSelector:
matchNames:
- demo
selector:
matchLabels:
app.kubernetes.io/instance: example-mysql-cluster
apps.kubeblocks.io/component-name: mysql
EOF
To confirm that Prometheus is scraping metrics, forward the Prometheus service to your local machine:
kubectl port-forward svc/prometheus-kube-prometheus-prometheus -n monitoring 9090:9090
Open your browser and navigate to: http://localhost:9090/targets
Check if there is a scrape job corresponding to the PodMonitor (the job name is 'monitoring/example-mysql-cluster-pod-monitor').
Expected State:
podTargetLabels (e.g., 'app_kubernetes_io_instance').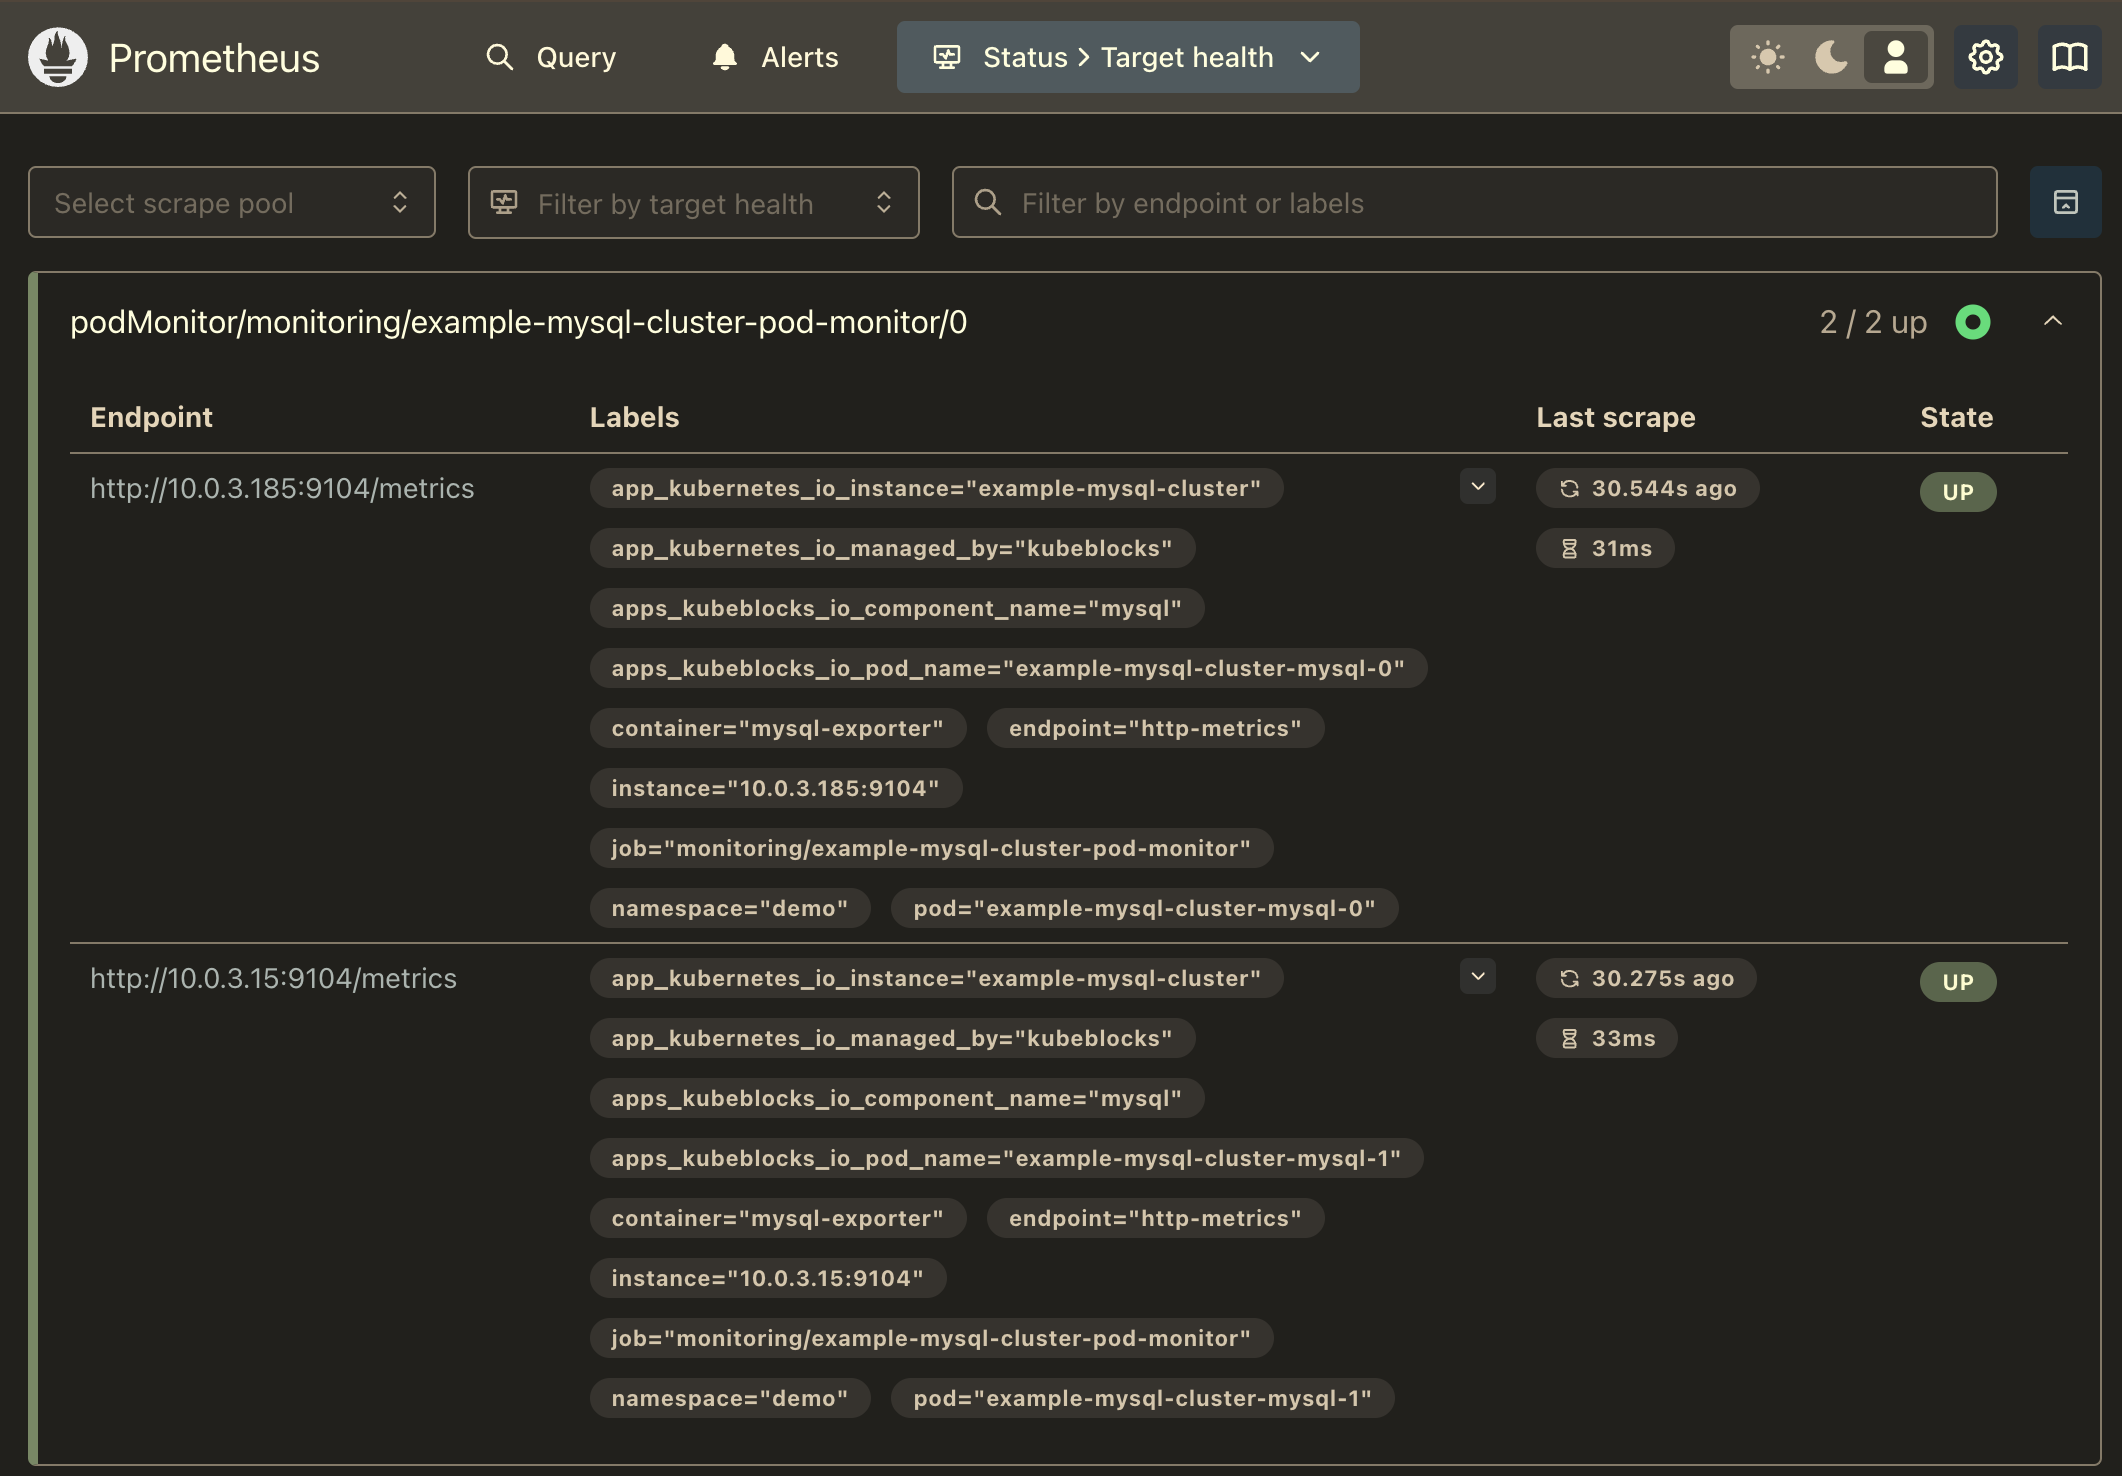
Run the following query to confirm that metrics are being scraped:
curl -sG "http://localhost:9090/api/v1/query" --data-urlencode 'query=mysql_up' | jq
Example Output:
{
  "status": "success",
  "data": {
    "resultType": "vector",
    "result": [
      {
        "metric": {
          "__name__": "mysql_up",
          "app_kubernetes_io_instance": "example-mysql-cluster",
          ...
        },
        "value": [
          1737816600.215,
          "1"
        ]
      },
      ...
    ]
  }
}
Forward the Grafana service to your local machine:
kubectl port-forward svc/prometheus-grafana -n monitoring 3000:80
Open your browser and navigate to http://localhost:3000. Use the default credentials to log in:
In Grafana, import a MySQL metrics dashboard and confirm that your metrics are being visualized correctly.
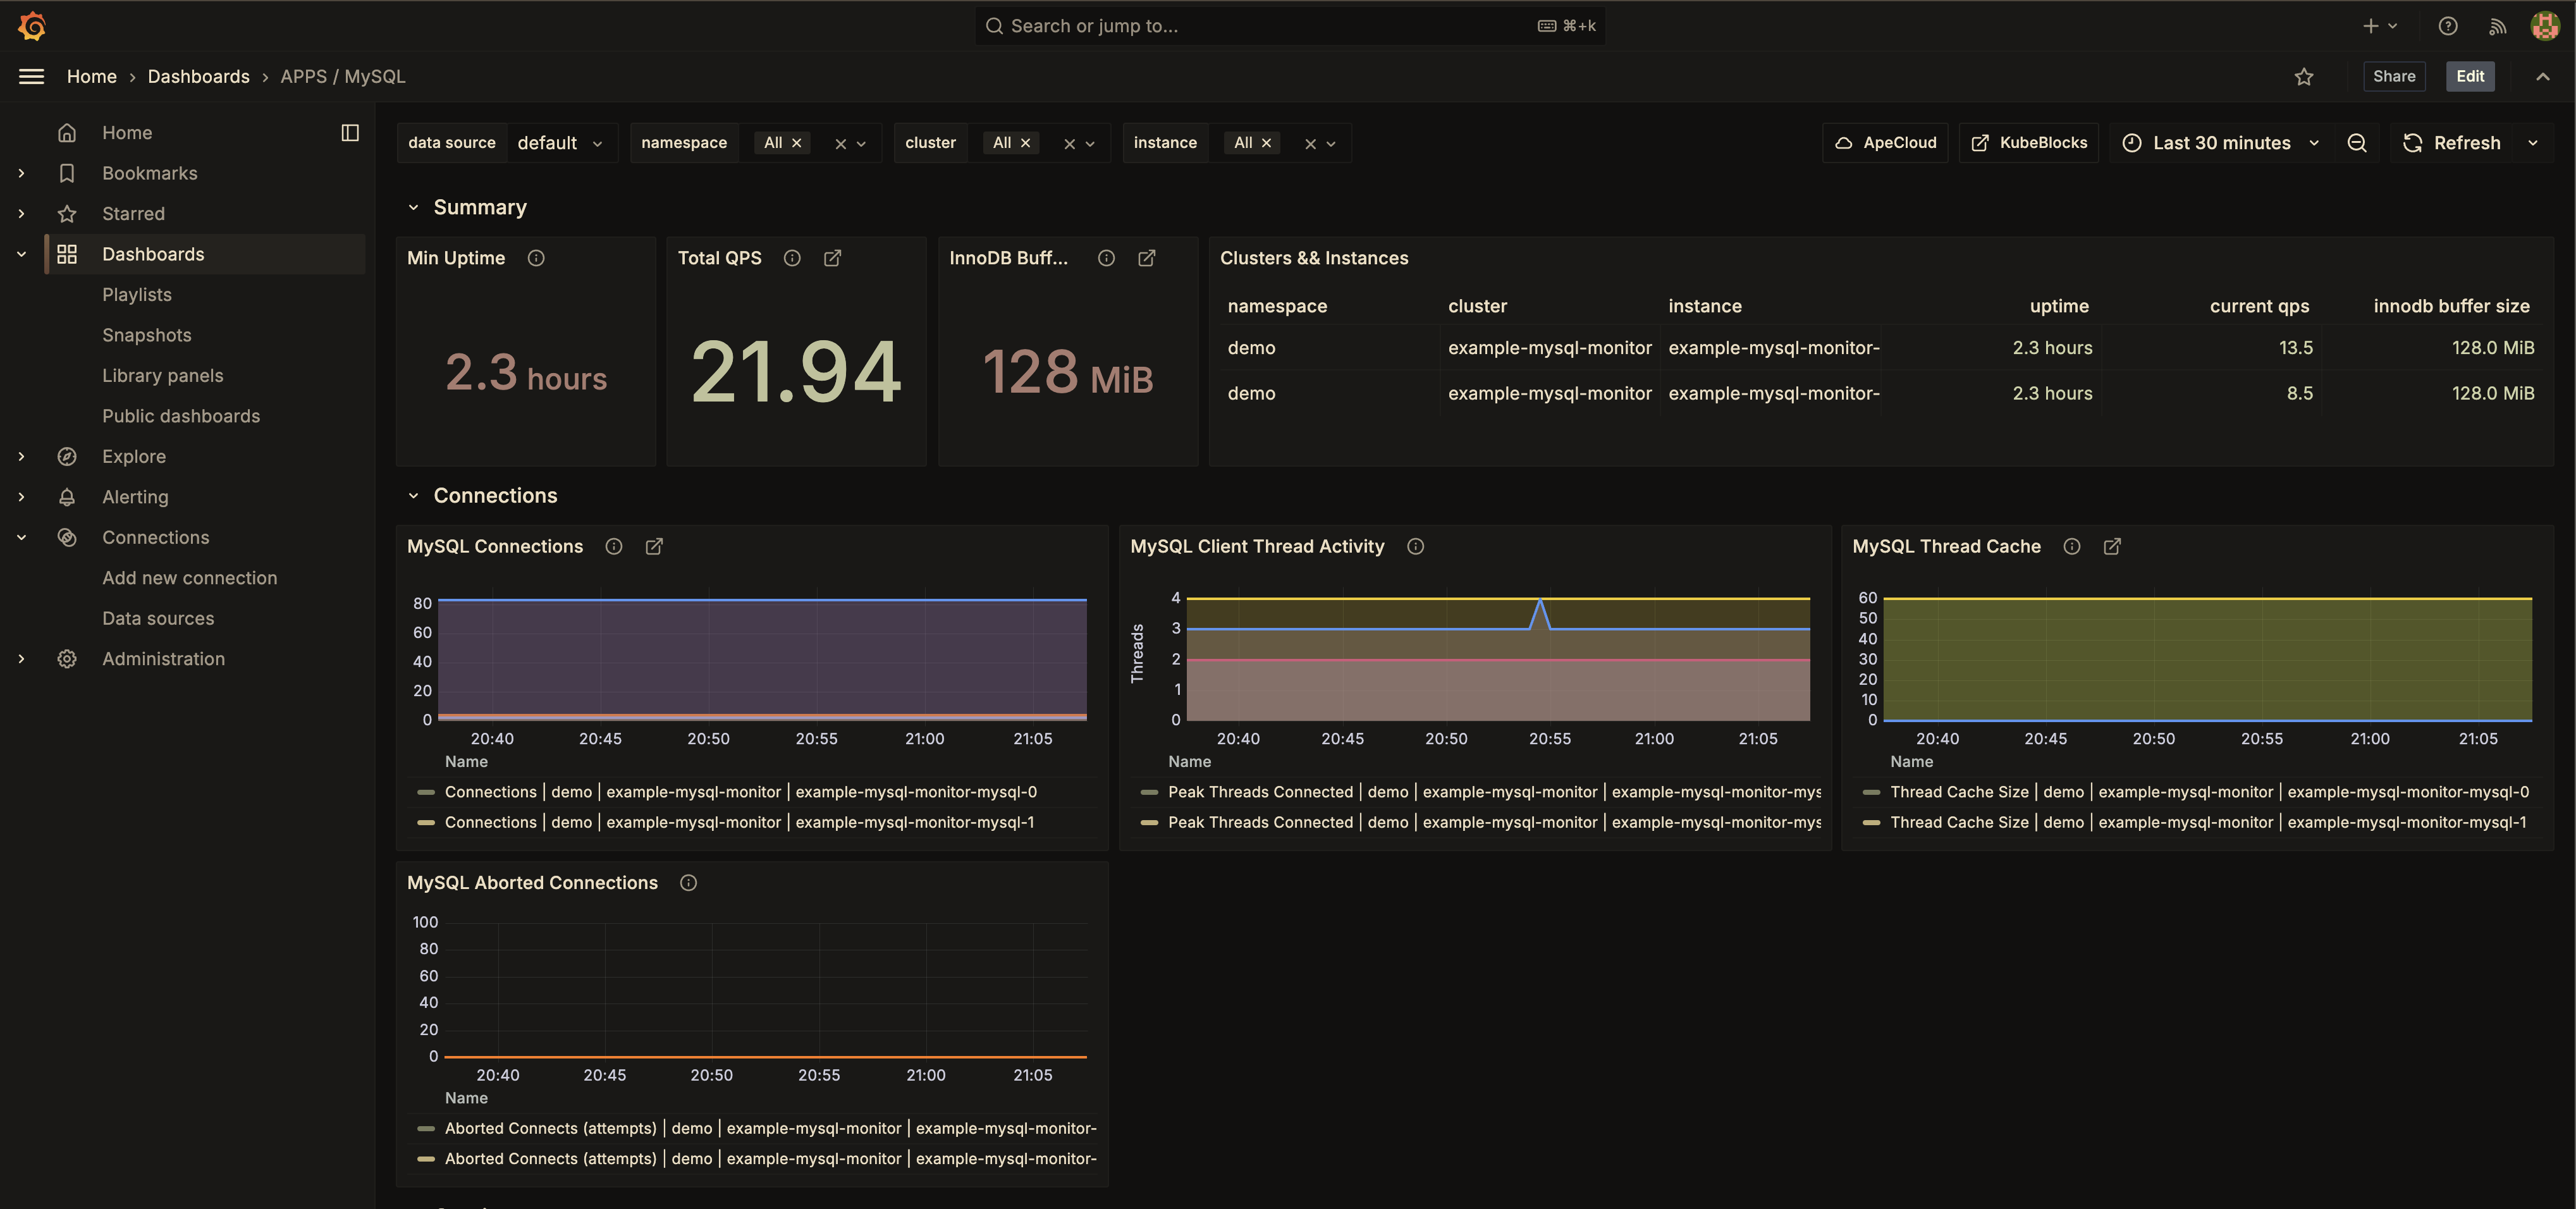
Make sure the labels are set correctly in the PodMonitor file to match the dashboard.
To delete all the created resources, run the following commands:
kubectl delete cluster example-mysql-cluster -n demo
kubectl delete ns demo

kubectl delete podmonitor example-mysql-cluster-pod-monitor -n monitoring
In this tutorial, we set up observability for a MySQL cluster in KubeBlocks using the Prometheus Operator. By configuring a PodMonitor, we enabled Prometheus to scrape metrics from the MySQL exporter. Finally, we visualized these metrics in Grafana. This setup provides valuable insights for monitoring the health and performance of your MySQL databases.