This guide demonstrates how to configure comprehensive monitoring for Kafka clusters in KubeBlocks using:
Before proceeding, ensure the following:
kubectl create ns demo
namespace/demo created
Deploy the kube-prometheus-stack using Helm:
helm repo add prometheus-community https://prometheus-community.github.io/helm-charts
helm install prometheus prometheus-community/kube-prometheus-stack \
  -n monitoring \
  --create-namespace
Check all components are running:
kubectl get pods -n monitoring
Expected Output:
NAME                                                     READY   STATUS    RESTARTS   AGE
alertmanager-prometheus-kube-prometheus-alertmanager-0   2/2     Running   0          114s
prometheus-grafana-75bb7d6986-9zfkx                      3/3     Running   0          2m
prometheus-kube-prometheus-operator-7986c9475-wkvlk      1/1     Running   0          2m
prometheus-kube-state-metrics-645c667b6-2s4qx            1/1     Running   0          2m
prometheus-prometheus-kube-prometheus-prometheus-0       2/2     Running   0          114s
prometheus-prometheus-node-exporter-47kf6                1/1     Running   0          2m1s
prometheus-prometheus-node-exporter-6ntsl                1/1     Running   0          2m1s
prometheus-prometheus-node-exporter-gvtxs                1/1     Running   0          2m1s
prometheus-prometheus-node-exporter-jmxg8                1/1     Running   0          2m1s
KubeBlocks uses a declarative approach for managing Kafka Clusters. Below is an example configuration for deploying a Kafka Cluster with 3 components
Apply the following YAML configuration to deploy the cluster:
apiVersion: apps.kubeblocks.io/v1
kind: Cluster
metadata:
  name: kafka-separated-cluster
  namespace: demo
spec:
  terminationPolicy: Delete
  clusterDef: kafka
  topology: separated_monitor
  componentSpecs:
    - name: kafka-broker
      serviceVersion: 3.3.2
      services:
        - name: advertised-listener
          serviceType: ClusterIP # Valid options are: [ClusterIP, NodePort, LoadBalancer]
          podService: true
      replicas: 1
      resources:
        limits:
          cpu: "0.5"
          memory: "0.5Gi"
        requests:
          cpu: "0.5"
          memory: "0.5Gi"
      env:
        - name: KB_KAFKA_BROKER_HEAP
          value: "-XshowSettings:vm -XX:MaxRAMPercentage=100 -Ddepth=64"
        - name: KB_KAFKA_CONTROLLER_HEAP
          value: "-XshowSettings:vm -XX:MaxRAMPercentage=100 -Ddepth=64"
          # Whether to enable direct Pod IP address access mode.
          # - If set to 'true', Kafka clients will connect to Brokers using the Pod IP address directly.
          # - If set to 'false', Kafka clients will connect to Brokers using the Headless Service's FQDN, and service `advertised-listener` must be set with "podService: true".
        - name: KB_BROKER_DIRECT_POD_ACCESS
          value: "false"
      volumeClaimTemplates:
        - name: data
          spec:
            storageClassName: ""
            accessModes:
              - ReadWriteOnce
            resources:
              requests:
                storage: 20Gi
        - name: metadata
          spec:
            storageClassName: ""
            accessModes:
              - ReadWriteOnce
            resources:
              requests:
                storage: 1Gi
    - name: kafka-controller
      serviceVersion: 3.3.2
      replicas: 1
      resources:
        limits:
          cpu: "0.5"
          memory: "0.5Gi"
        requests:
          cpu: "0.5"
          memory: "0.5Gi"
      volumeClaimTemplates:
        - name: metadata
          spec:
            storageClassName: ""
            accessModes:
              - ReadWriteOnce
            resources:
              requests:
                storage: 1Gi
    - name: kafka-exporter
      serviceVersion: 1.6.0
      replicas: 1
      resources:
        limits:
          cpu: "0.5"
          memory: "1Gi"
        requests:
          cpu: "0.1"
          memory: "0.2Gi"
These three components will be created strictly in controller->broker->exporter order as defined in ClusterDefinition.
Monitor the cluster status until it transitions to the Running state:
kubectl get cluster kafka-separated-cluster -n demo -w
Expected Output:
kubectl get cluster kafka-separated-cluster -n demo
NAME                      CLUSTER-DEFINITION   TERMINATION-POLICY   STATUS     AGE
kafka-separated-cluster   kafka                Delete               Creating   13s
kafka-separated-cluster   kafka                Delete               Running    63s
Check the pod status and roles:
kubectl get pods -l app.kubernetes.io/instance=kafka-separated-cluster -n demo
Expected Output:
NAME                                         READY   STATUS    RESTARTS   AGE
kafka-separated-cluster-kafka-broker-0       2/2     Running   0          13m
kafka-separated-cluster-kafka-controller-0   2/2     Running   0          13m
kafka-separated-cluster-kafka-exporter-0     1/1     Running   0          12m
Once the cluster status becomes Running, your Kafka cluster is ready for use.
If you are creating the cluster for the very first time, it may take some time to pull images before running.
kubectl get po -n demo kafka-separated-cluster-kafka-broker-0 -oyaml | yq '.spec.containers[] | select(.name=="jmx-exporter") | .ports'
- containerPort: 5556
  name: metrics
  protocol: TCP
kubectl get po -n demo kafka-separated-cluster-kafka-exporter-0 -oyaml | yq '.spec.containers[] | select(.name=="kafka-exporter") | .ports'
- containerPort: 9308
  name: metrics
  protocol: TCP
Check jmx-exporter:
kubectl -n demo exec -it pods/kafka-separated-cluster-kafka-broker-0  -- \
    curl -s http://127.0.0.1:5556/metrics | head -n 50
Check kafka-exporter:
kubectl -n demo exec -it pods/kafka-separated-cluster-kafka-broker-0  -- \
  curl -s http://kafka-separated-cluster-kafka-exporter-0.kafka-separated-cluster-kafka-exporter-headless.demo.svc:9308/metrics | head -n 50
apiVersion: monitoring.coreos.com/v1
kind: PodMonitor
metadata:
  name: kafka-jmx-pod-monitor
  namespace: demo
  labels:               # match labels in `prometheus.spec.podMonitorSelector`
    release: prometheus
spec:
  jobLabel: app.kubernetes.io/managed-by
  # defines the labels which are transferred from the
  # associated Kubernetes `Pod` object onto the ingested metrics
  # set the lables w.r.t you own needs
  podTargetLabels:
  - app.kubernetes.io/instance
  - app.kubernetes.io/managed-by
  - apps.kubeblocks.io/component-name
  - apps.kubeblocks.io/pod-name
  podMetricsEndpoints:
    - path: /metrics
      port: metrics
      scheme: http
  namespaceSelector:
    matchNames:
      - demo
  selector:
    matchLabels:
      app.kubernetes.io/instance: kafka-separated-cluster
PodMonitor Configuration Guide
| Parameter | Required | Description |
|---|---|---|
port | Yes | Must match exporter port name ('http-metrics') |
namespaceSelector | Yes | Targets namespace where Kafka runs |
labels | Yes | Must match Prometheus's podMonitorSelector |
path | No | Metrics endpoint path (default: /metrics) |
interval | No | Scraping interval (default: 30s) |
Forward and access Prometheus UI:
kubectl port-forward svc/prometheus-kube-prometheus-prometheus -n monitoring 9090:9090
Open your browser and navigate to: http://localhost:9090/targets
Check if there is a scrape job corresponding to the PodMonitor (the job name is 'demo/kafka-separated-cluster-pod-monitor').
Expected State:
podTargetLabels (e.g., 'app_kubernetes_io_instance').Verify metrics are being scraped:
curl -sG "http://localhost:9090/api/v1/query" --data-urlencode 'query=up{app_kubernetes_io_instance="kafka-separated-cluster"}' | jq
Example Output:
{
  "status": "success",
  "data": {
    "resultType": "vector",
    "result": [
      {
        "metric": {
          "__name__": "up",
          "app_kubernetes_io_instance": "kafka-separated-cluster",
          "app_kubernetes_io_managed_by": "kubeblocks",
          "apps_kubeblocks_io_component_name": "kafka-broker",
          "apps_kubeblocks_io_pod_name": "kafka-separated-cluster-kafka-broker-2",
          "container": "jmx-exporter",
          "endpoint": "metrics",
          "instance": "10.244.0.236:5556",
          "job": "kubeblocks",
          "namespace": "demo",
          "pod": "kafka-separated-cluster-kafka-broker-2"
        },
        "value": [
          1747654851.995,
          "1"
        ]
      },
... // more lines ommited
Port-forward and login:
kubectl port-forward svc/prometheus-grafana -n monitoring 3000:80
Open your browser and navigate to http://localhost:3000. Use the default credentials to log in:
Import the KubeBlocks Kafka dashboard:
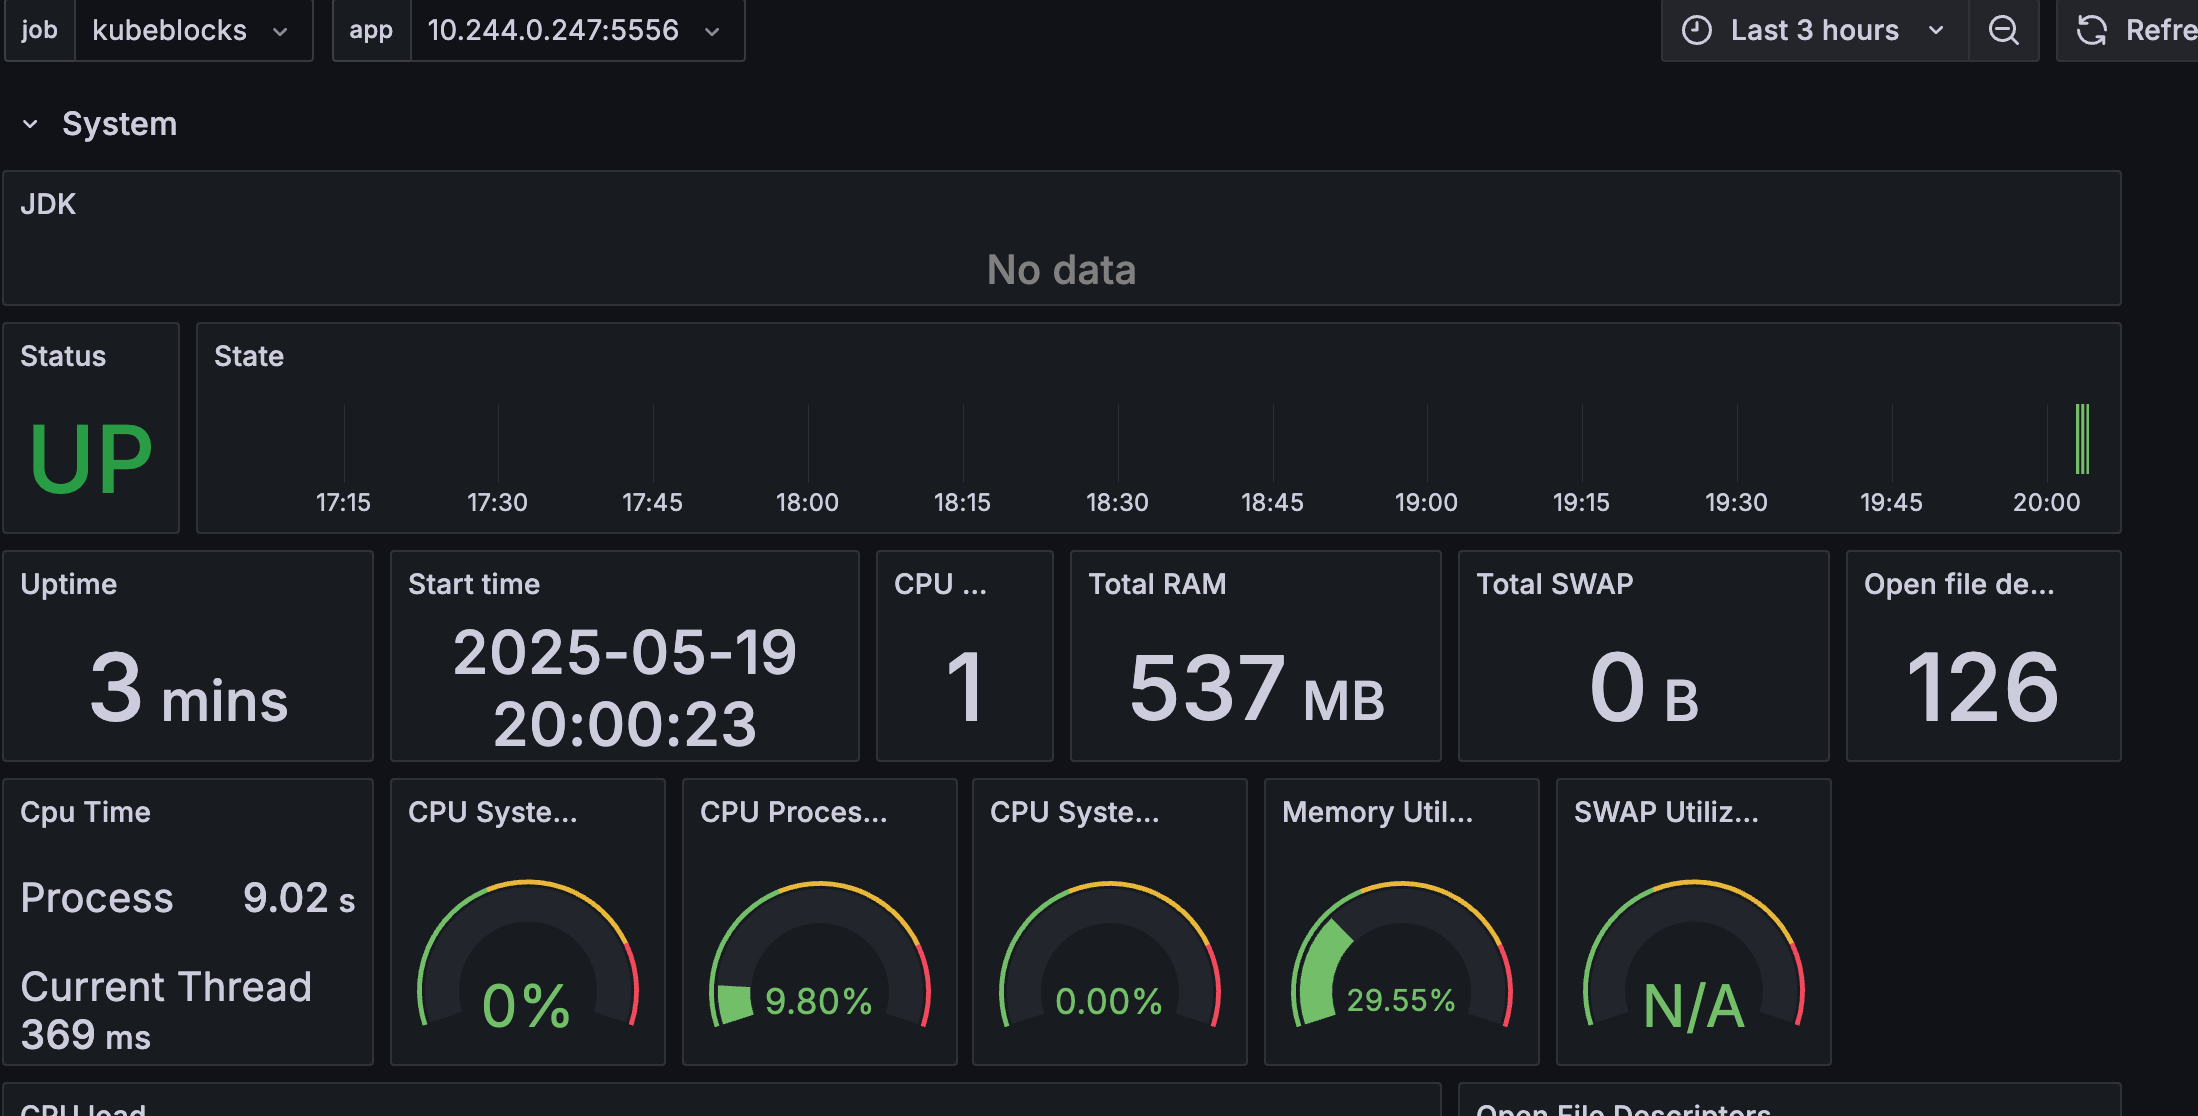 Figure 1. Kafka jmx dashboard
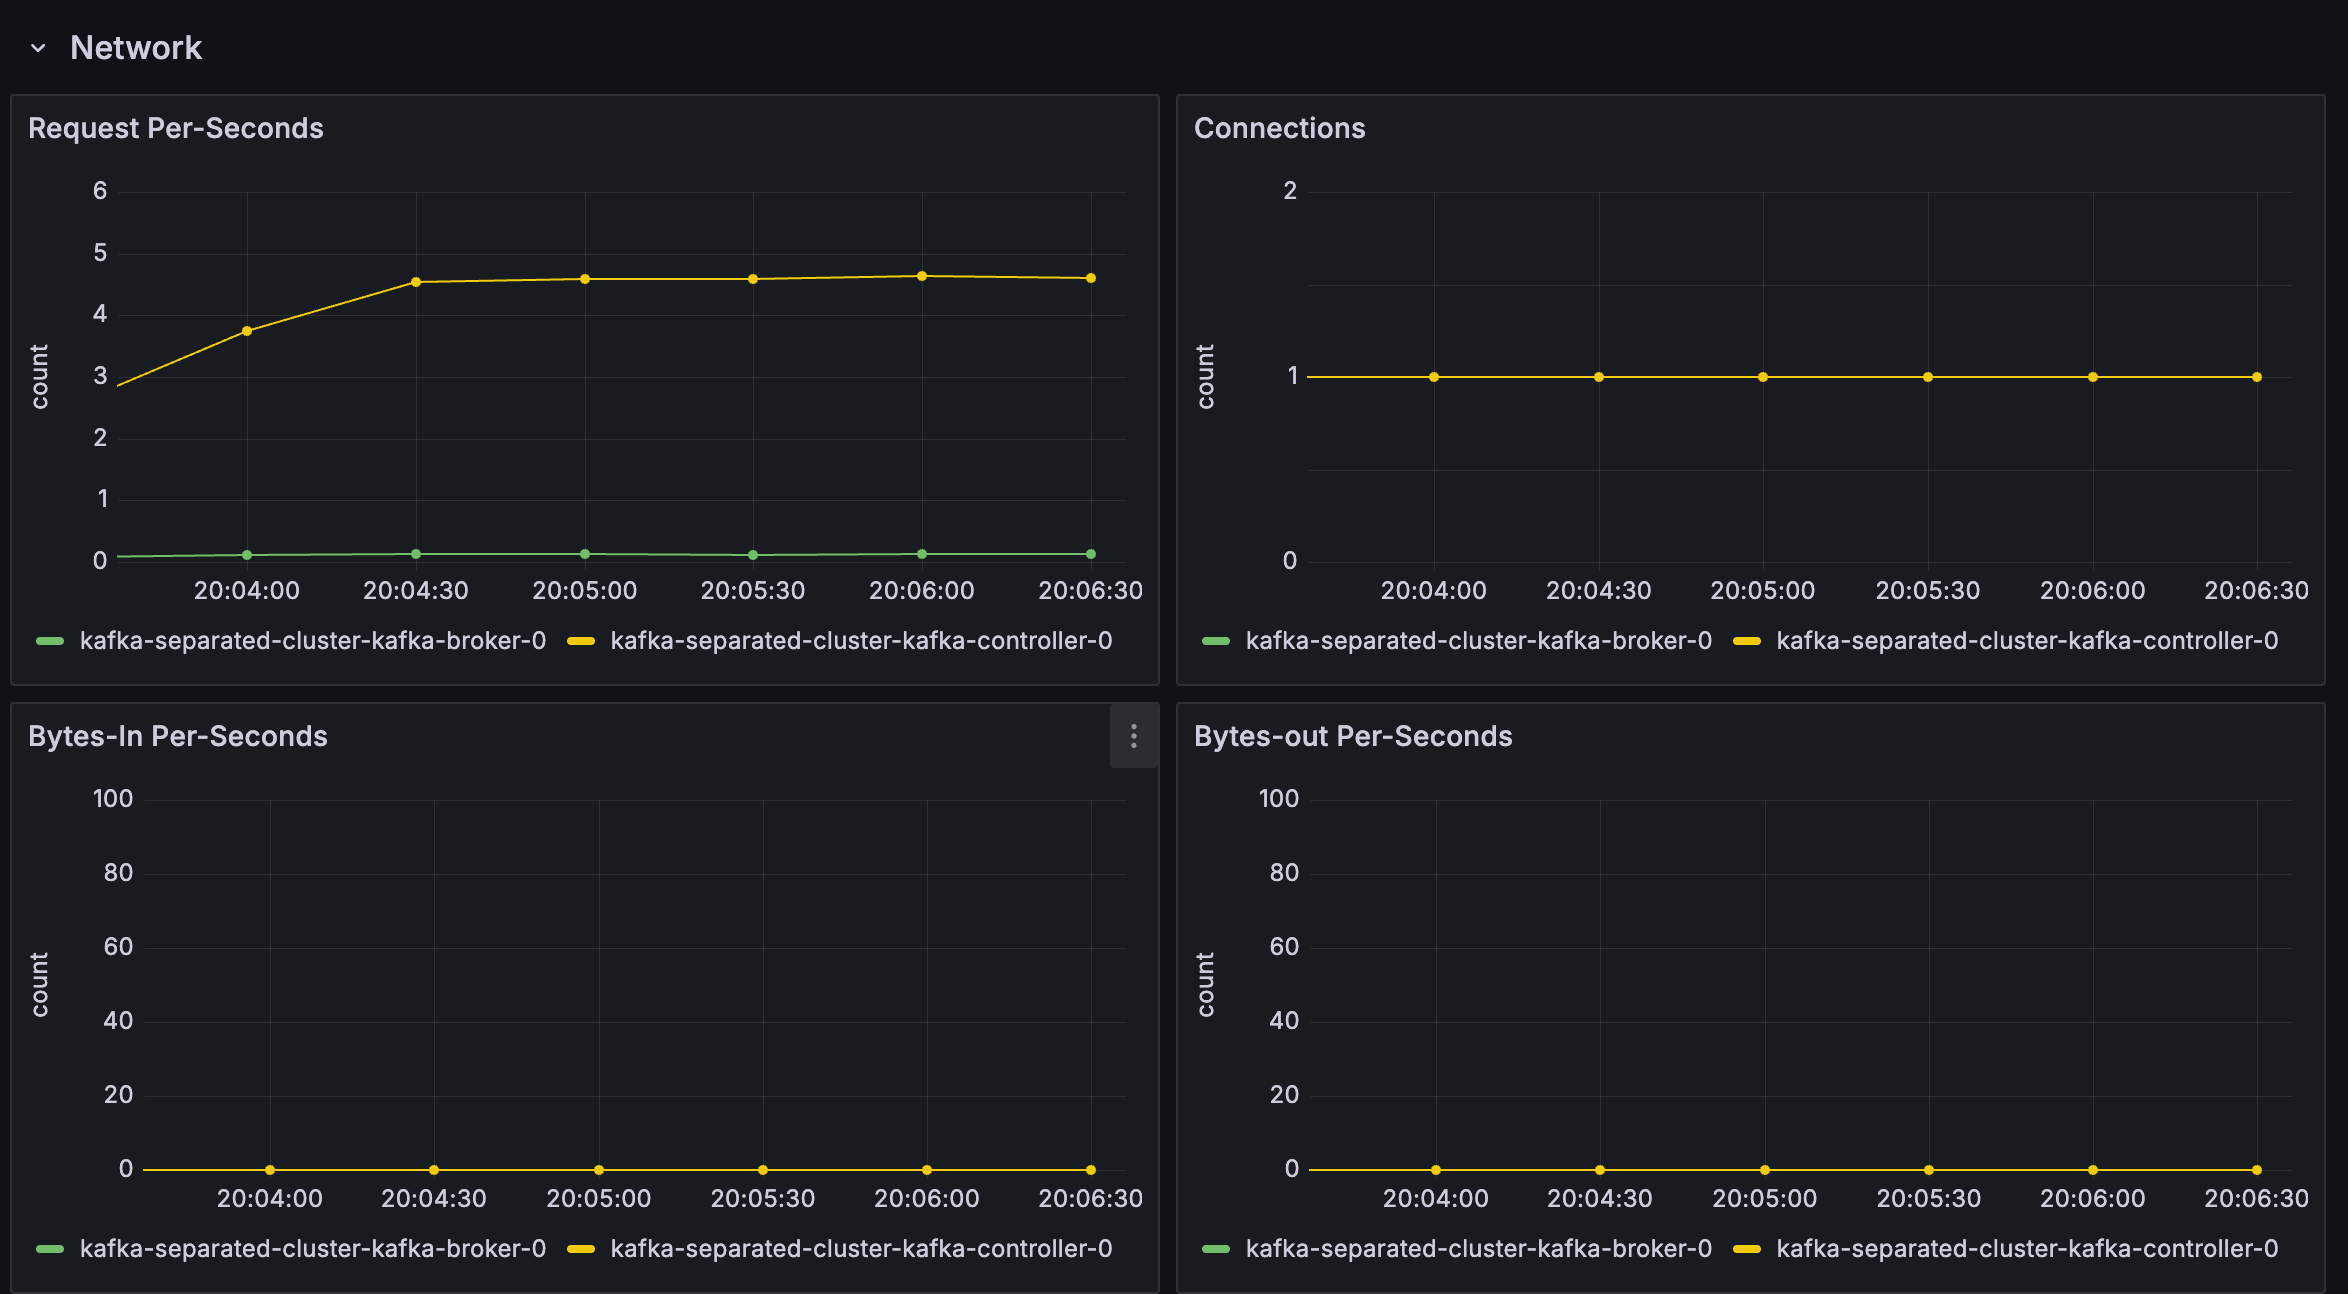 Figure 2. Kafka exporter dashboard
To delete all the created resources, run the following commands:
kubectl delete cluster kafka-separated-cluster -n demo
kubectl delete ns demo
kubectl delete podmonitor kafka-separated-cluster-pod-monitor -n demo
In this tutorial, we set up observability for a Kafka cluster in KubeBlocks using the Prometheus Operator.
By configuring a PodMonitor, we enabled Prometheus to scrape metrics from the Kafka exporter.
Finally, we visualized these metrics in Grafana. This setup provides valuable insights for monitoring the health and performance of your Kafka databases.