Operations
Backup And Restores
Custom Secret
Monitoring
tpl
This guide demonstrates how to configure comprehensive monitoring for Redis clusters in KubeBlocks using:
Before proceeding, ensure the following:
kubectl create ns demo
namespace/demo created
Deploy the kube-prometheus-stack using Helm:
helm repo add prometheus-community https://prometheus-community.github.io/helm-charts
helm install prometheus prometheus-community/kube-prometheus-stack \
  -n monitoring \
  --create-namespace
Check all components are running:
kubectl get pods -n monitoring
Example Output:
NAME                                                     READY   STATUS    RESTARTS   AGE
alertmanager-prometheus-kube-prometheus-alertmanager-0   2/2     Running   0          114s
prometheus-grafana-75bb7d6986-9zfkx                      3/3     Running   0          2m
prometheus-kube-prometheus-operator-7986c9475-wkvlk      1/1     Running   0          2m
prometheus-kube-state-metrics-645c667b6-2s4qx            1/1     Running   0          2m
prometheus-prometheus-kube-prometheus-prometheus-0       2/2     Running   0          114s
prometheus-prometheus-node-exporter-47kf6                1/1     Running   0          2m1s
prometheus-prometheus-node-exporter-6ntsl                1/1     Running   0          2m1s
prometheus-prometheus-node-exporter-gvtxs                1/1     Running   0          2m1s
prometheus-prometheus-node-exporter-jmxg8                1/1     Running   0          2m1s
KubeBlocks uses a declarative approach for managing Redis Replication Clusters. Below is an example configuration for deploying a Redis Replication Cluster with two components, redis and redis sentinel.
Apply the following YAML configuration to deploy the cluster:
apiVersion: apps.kubeblocks.io/v1
kind: Cluster
metadata:
  name: redis-replication
  namespace: demo
spec:
  terminationPolicy: Delete
  clusterDef: redis
  topology: replication
  componentSpecs:
    - name: redis
      serviceVersion: "7.2.4"
      disableExporter: false
      replicas: 2
      resources:
        limits:
          cpu: '0.5'
          memory: 0.5Gi
        requests:
          cpu: '0.5'
          memory: 0.5Gi
      volumeClaimTemplates:
        - name: data
          spec:
            storageClassName: ""
            accessModes:
              - ReadWriteOnce
            resources:
              requests:
                storage: 20Gi
    - name: redis-sentinel
      serviceVersion: "7.2.4"
      replicas: 3
      resources:
        limits:
          cpu: '0.5'
          memory: 0.5Gi
        requests:
          cpu: '0.5'
          memory: 0.5Gi
      volumeClaimTemplates:
        - name: data
          spec:
            storageClassName: ""
            accessModes:
              - ReadWriteOnce
            resources:
              requests:
                storage: 20Gi
Key Monitoring Configuration
disableExporter: false enables the built-in metrics exporterMonitor the cluster status until it transitions to the Running state:
kubectl get cluster redis-replication -n demo -w
Example Output:
NAME                CLUSTER-DEFINITION   TERMINATION-POLICY   STATUS     AGE
redis-replication   redis           Delete               Creating   50s
redis-replication   redis           Delete               Running    4m2s
Once the cluster status becomes Running, your Redis cluster is ready for use.
Confirm metrics are exposed:
kubectl get po redis-replication-redis-0 -n demo -oyaml | \
  yq '.spec.containers[] | select(.name=="metrics") | .ports'
Example Output:
- containerPort: 9121
  name: http-metrics  # Used in PodMonitor
  protocol: TCP
Test metrics endpoint:
kubectl -n demo exec -it pods/redis-replication-redis-0 -c metrics -- \
  curl -s http://127.0.0.1:9121/metrics | head -n 50
apiVersion: monitoring.coreos.com/v1
kind: PodMonitor
metadata:
  name: redis-replication-pod-monitor
  namespace: demo
  labels:               # Must match the setting in 'prometheus.spec.podMonitorSelector'
    release: prometheus
spec:
  jobLabel: app.kubernetes.io/managed-by
  # defines the labels which are transferred from the
  # associated Kubernetes 'Pod' object onto the ingested metrics
  # set the lables w.r.t you own needs
  podTargetLabels:
  - app.kubernetes.io/instance
  - app.kubernetes.io/managed-by
  - apps.kubeblocks.io/component-name
  - apps.kubeblocks.io/pod-name
  podMetricsEndpoints:
    - path: /metrics
      port: http-metrics   # Must match exporter port name
      scheme: http
  namespaceSelector:
    matchNames:
      - demo               # Target namespace
  selector:
    matchLabels:
      app.kubernetes.io/instance: redis-replication
      apps.kubeblocks.io/component-name: redis
PodMonitor Configuration Guide
| Parameter | Required | Description |
|---|---|---|
port | Yes | Must match exporter port name ('http-metrics') |
namespaceSelector | Yes | Targets namespace where Redis runs |
labels | Yes | Must match Prometheus's podMonitorSelector |
path | No | Metrics endpoint path (default: /metrics) |
interval | No | Scraping interval (default: 30s) |
Forward and access Prometheus UI:
kubectl port-forward svc/prometheus-kube-prometheus-prometheus -n monitoring 9090:9090
Open your browser and navigate to: http://localhost:9090/targets
Check if there is a scrape job corresponding to the PodMonitor (the job name is 'demo/redis-replication-pod-monitor').
Expected State:
podTargetLabels (e.g., 'app_kubernetes_io_instance').Verify metrics are being scraped:
curl -sG "http://localhost:9090/api/v1/query" --data-urlencode 'query=redis_up{app_kubernetes_io_instance="redis-replication"}' | jq
Example Output:
{
  "status": "success",
  "data": {
    "resultType": "vector",
    "result": [
      {
        "metric": {
          "__name__": "redis_up",
          "app_kubernetes_io_instance": "redis-replication",
          "app_kubernetes_io_managed_by": "kubeblocks",
          "apps_kubeblocks_io_component_name": "redis",
          "apps_kubeblocks_io_pod_name": "redis-replication-redis-1",
          "container": "metrics",
          "endpoint": "http-metrics",
          "instance": "10.244.0.233:9121",
          "job": "kubeblocks",
          "namespace": "demo",
          "pod": "redis-replication-redis-1"
        },
        "value": [
          1747475968.165,
          "1"
        ]
      },
      {
        "metric": {
          "__name__": "redis_up",
          "app_kubernetes_io_instance": "redis-replication",
          "app_kubernetes_io_managed_by": "kubeblocks",
          "apps_kubeblocks_io_component_name": "redis",
          "apps_kubeblocks_io_pod_name": "redis-replication-redis-0",
          "container": "metrics",
          "endpoint": "http-metrics",
          "instance": "10.244.0.231:9121",
          "job": "kubeblocks",
          "namespace": "demo",
          "pod": "redis-replication-redis-0"
        },
        "value": [
          1747475968.165,
          "1"
        ]
      }
    ]
  }
}
Port-forward and login:
kubectl port-forward svc/prometheus-grafana -n monitoring 3000:80
Open your browser and navigate to http://localhost:3000. Use the default credentials to log in:
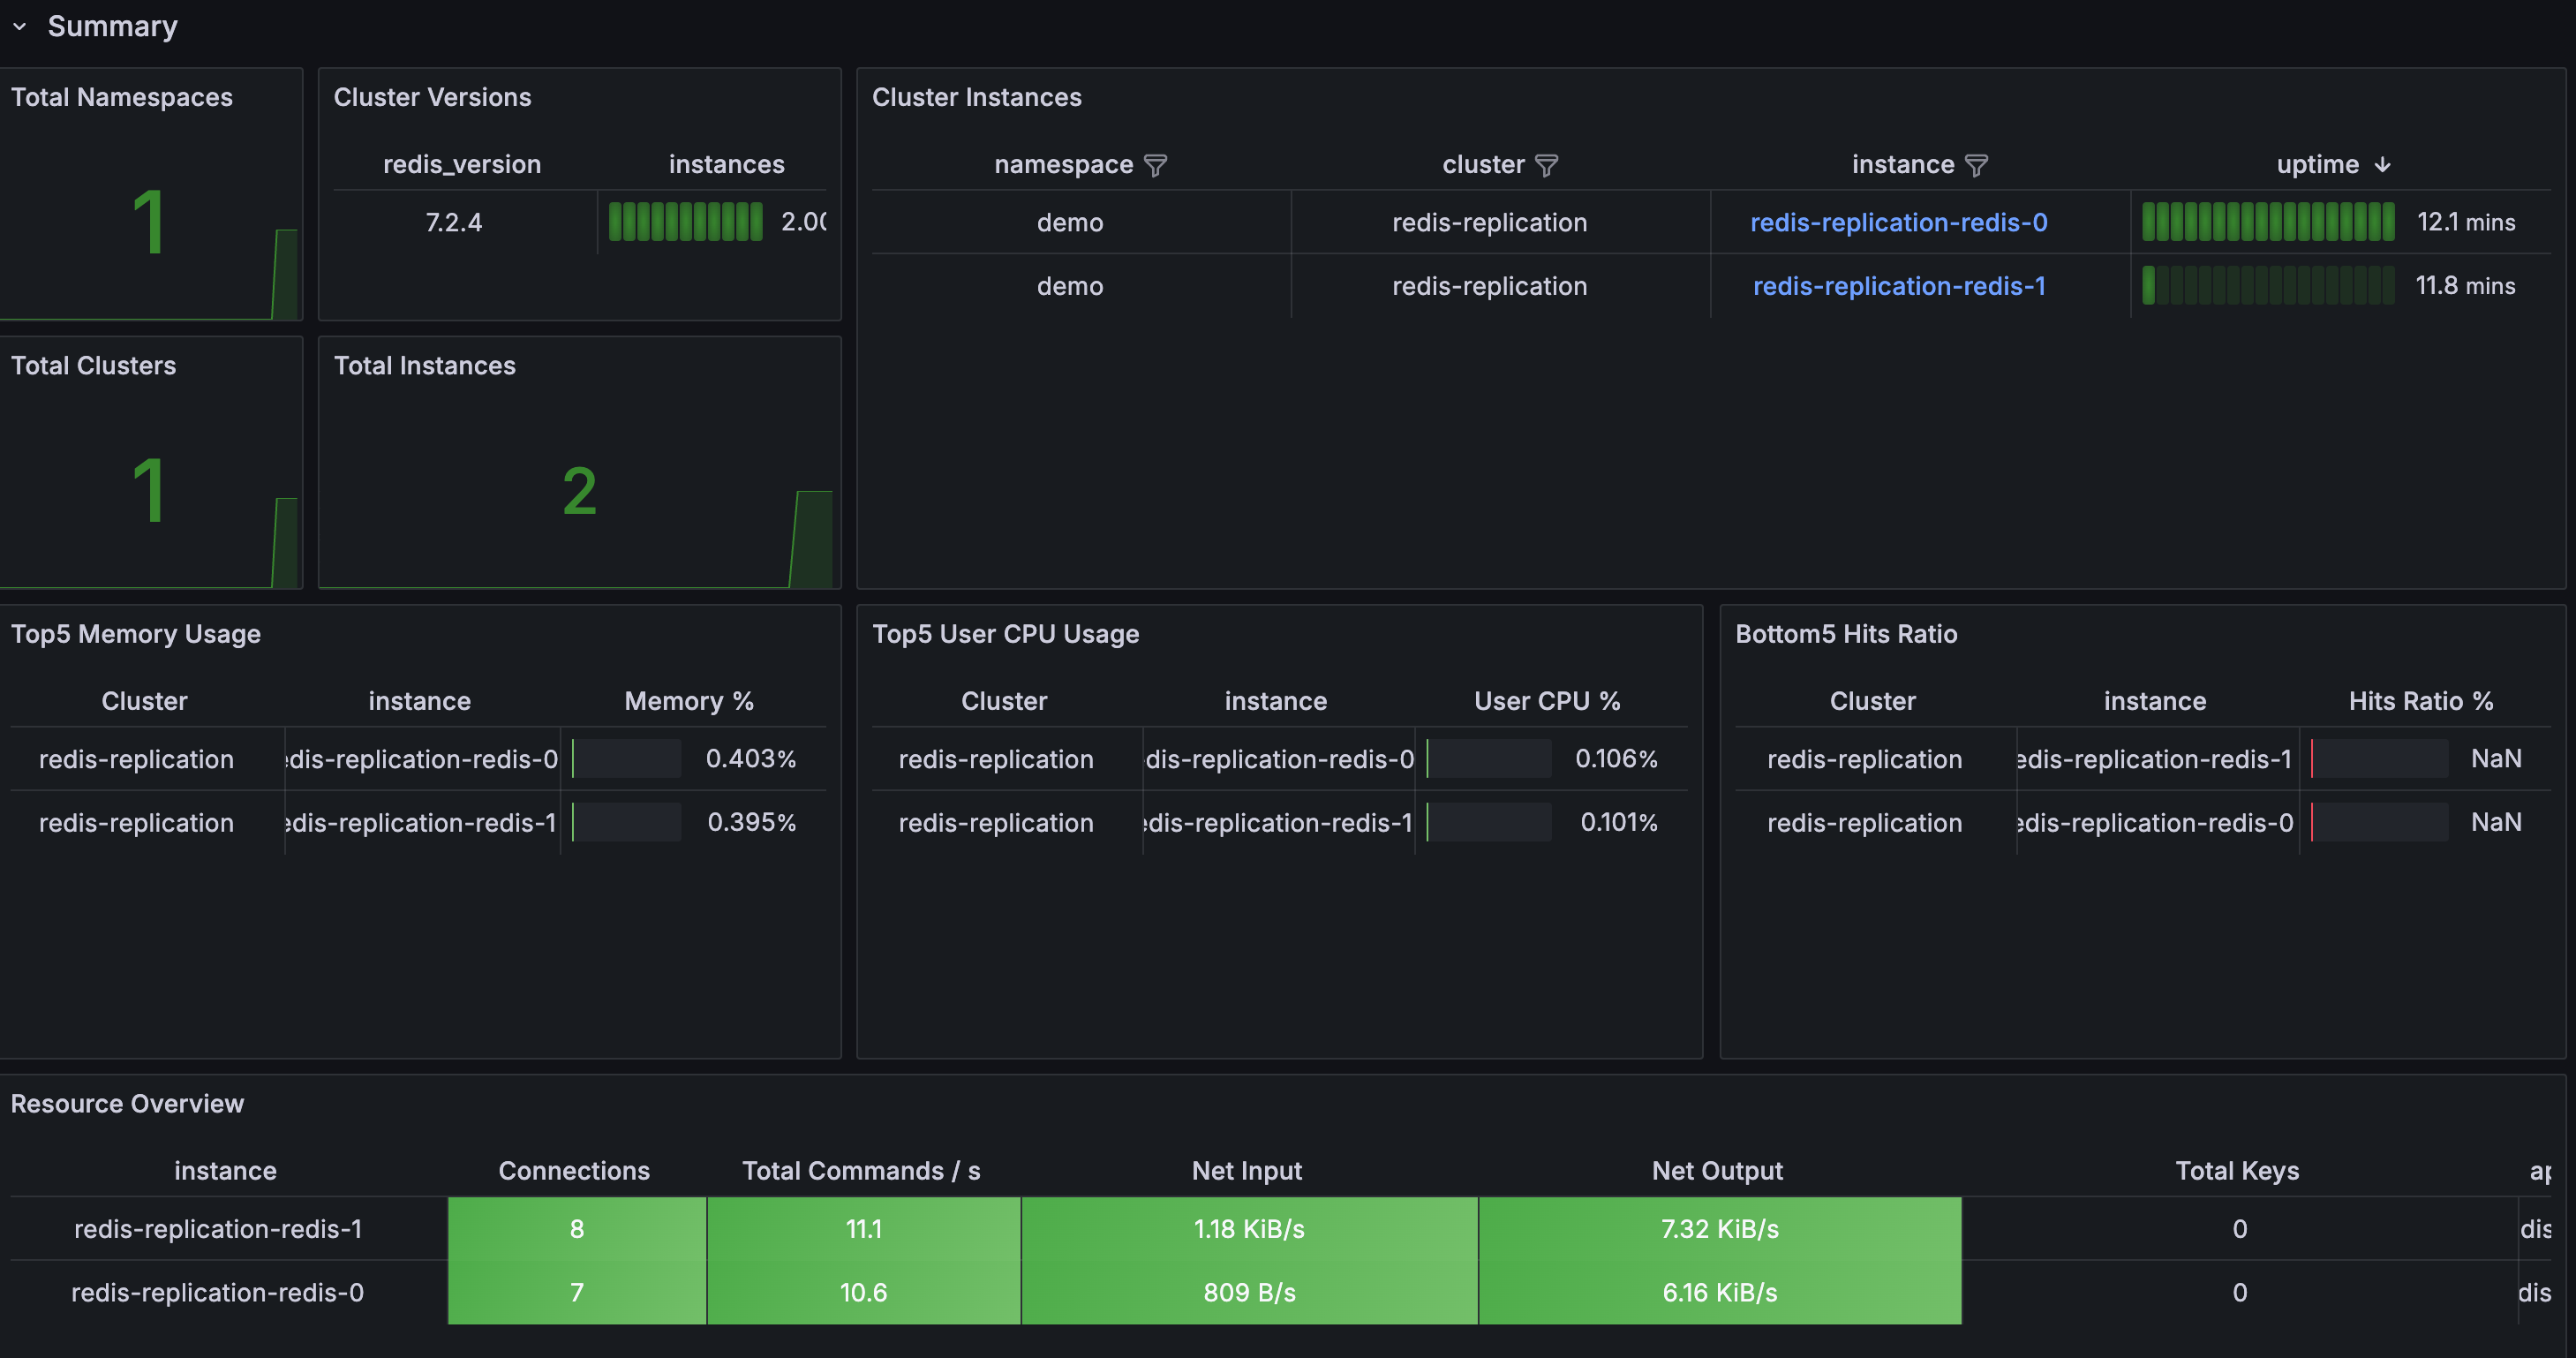
Import the KubeBlocks Redis dashboard:
https://raw.githubusercontent.com/apecloud/kubeblocks-addons/main/addons/redis/dashboards/redis.jsonDashboard Includes:
To delete all the created resources, run the following commands:
kubectl delete cluster redis-replication -n demo
kubectl delete ns demo
kubectl delete podmonitor redis-replication-pod-monitor -n demo
In this tutorial, we set up observability for a Redis cluster in KubeBlocks using the Prometheus Operator.
By configuring a PodMonitor, we enabled Prometheus to scrape metrics from the Redis exporter.
Finally, we visualized these metrics in Grafana. This setup provides valuable insights for monitoring the health and performance of your Redis databases.